
It’s (roughly) the beginning of a new year, so it’s time for another edition of one of my favorite series on this site: Numberbrag! If you’re new here, Numberbrag is my generally annual post where I review how my blog performed the previous year, using only WordPress stats. Here’s last year’s edition.
In that post, I alluded to a new blogging routine that really carried me through 2020: one long-form post and one haiku, on the same days and at the same times, every week. I occasionally missed my usual publication time, but I never missed a day. In short, my blogging routine for this year was nothing short of a massive success, for me personally and for my number-bragging.
Let’s get to it.
The Top-Line Numbers

First of all, very strange that 2021 is the eighth year of this site. Secondly, 2020 was pretty solid!
- Views: 6,135
- Visitors: 4,692
- Likes: 923
- Comments: 52
- Posts: 134
Now, some folks might find the slight downward trend from 2018 to 2020 a little odd or even disconcerting. However, 2018 was the year I published my first novel. As part of the run-up to that publication, I used pay-per-click ads to drive traffic to this site, boosting the totals for 2018 by over 1,000 Visitors and Views. So that peak is a little inflated.
Secondly, I’m not the least bit concerned that 2020 did not match even 2017’s total Views. In 2017, we had two bloggers posting 3-5 times per week for a total of 262 posts. Want to know how many posts were published the last two years? 214 and 134. One hundred and thirty-four posts in 2020, in a year that started slowly, and my numbers are still on par with, if a little short of, past performance. That’s efficiency.
It also indicates quality of content. Check out this deeper annual comparison. (Note: I realize that the Total Posts in the below screenshot say 131, whereas the image above says 134. I know there is a logical if annoying reason for that happening in WordPress’s system, but I don’t remember what it is.)
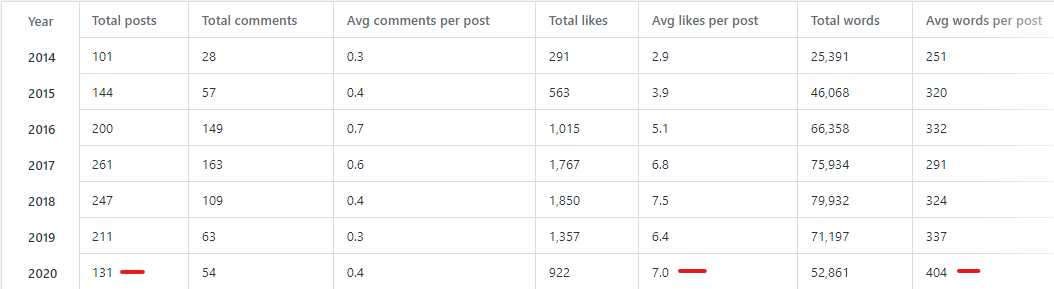
2020 posts were waaaaaay down from previous years — every year since we started, in fact. Comments per post are steady, and Total Words are down. But Average likes per post is up (7.0), the second-highest rate we’ve ever had, and Words per post (404) is the highest ever. That means that the content we’re publishing here is more popular, even at higher word counts, where readers may get bored and leave.
This post is officially longer than 404 words, by the way.
The Fun Numbers
I’m going to skip over the usual Top 10 Posts section, because there’s not much different to say from any other year. Our new Home page clocked in at #4 with 184 Views. The other 9 on that list are old-familiars that were published prior to 2020.
What I’d rather look at are the categories I personally posted in this year. Marcy contributed 25 posts of her own, and I’m so happy she did. But this section is about me!
I ended last year’s Numberbrag by guesstimating how many posts I wanted to write in each category, so of course I have to follow-up on that. Here’s the gist of what I predicted/wanted to achieve this time last year:
- Haiku – 50+ posts
- Fantasy – 16+
- Reviews – 15+
- Creativity Sessions – 12+
- Marketing Your Novel – 10+
So what did I actually write last year?
- Haiku – 55 posts
- Fantasy – 15 posts
- Reviews – 12 posts
- Creativity Sessions – 10 posts
- Marketing Your Novel – 8 posts
Wow. Chalk. I’m honestly surprised at how close my predictions were. My Reviews were only down by 3, even though I stopped commuting to work and thus couldn’t listen to Audible as reliably. Creativity Sessions and Marketing Your Novel were each down by 2, but that can be explained by the 3 extra Haiku I posted on non-haiku days when I was too busy or stressed to write a real post.
Also, I definitely would have written at least two more Marketing posts if I had gone to a number of conventions greater than 0.
So, a boring rundown, if precision can be considered boring.
I honestly thought that section was going to be longer, so I’ll round out this post with some more generic stats.

We’ve done “Thank You” type posts in the past when we’ve reached certain milestones, but I didn’t do any of that this past year, because my more sensible blogging schedule meant I consistently had other things to talk about.
As of this writing, we’ve eclipsed 28,000 Visitors and 40,000 Views. We also now have over 700 followers. (Shout-out to all the fitness bloggers who likely found us because I talked about yoga a lot in 2020.)
That’s awesome. Thank you, dear readers, for your continued support. Despite the lack of humility in this post (it’s called Numberbrag!), I really am chuffed that this site has evolved so much over the last 7+ years, and yet continues to have an audience. I don’t particularly care that we don’t see 100 hits per day or thousands of followers. I’m always happy to see familiar avatars liking and commenting on our posts, so I hope you all keep coming back. I’ve firmly settled into a rhythm with this site, and I’m sticking to it.
At least until I need another change-up.
Steve D
